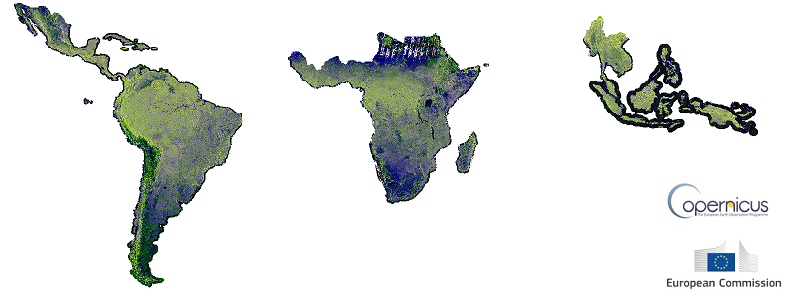
Sentinel-1A (S1A) was launched on 03 April 2014 and is the first Copernicus sensor operationally providing imagery since October 2014.
S1A acquires C-band SAR imagery over land at 10m resolution (IW mode). Sentinel-1B was launched on 25 April 2016. The Sentinel 1 platform has wide swath
widths (185 km) and a 12-day revisit frequency. Since S1A is an active microwave sensor (C-band Synthetic Aperture Radar), with all-weather day and night
acquisition capacity, a combination of descending (morning) and ascending (late afternoon) passes can be used to create denser time series in areas where
these passes overlap. The Sentinel-1 platform provides data from a dual-polarization C-band Synthetic Aperture Radar (SAR) instrument.
This dataset includes the S1 Ground Range Detected (GRD) scenes, processed using the Sentinel-1 Toolbox to generate a calibrated, ortho-corrected product.
The pan tropical Sentinel 1 mosaic has been constructed with the objective to facilitate investigations on the role of forests in climate, biogeochemistry, hydrology, and biodiversity fields. The main objective in producing annual mosaics is (i) to build a baseline C-band backscatter of tropical regions and (ii) to assess radar backscatter changes between different years in future land cover change studies. A second annual mosaic is intended to be produced at the end of 2018.
The Sentinel 1 composite over the tropical belt has been produced by processing all available Sentinel 1A and 1B imagery from October 2016 to October 2017. The value of each output pixels correspond to the 'mean' value of the Sentinel1 collection after:
The Sentinel-1 pan tropical composite is accessible via a dedicated web site
Interpretation of a single band image:
When viewing single polarized imagery (i.e. VV backscatter), open water and bare dry soil appear dark. Urban areas tend to be bright (due to double bounce reflections).
Forests tend to have a constant backscatter signal between the brightness levels of urban areas and water, and they appear grey.
Cultivated agricultural fields will have varying backscattering, depending on soil moisture and roughness state and crop canopy coverage, which are averaged over the period of the composite.
Cropped areas are recognizable from their parcel structure.
In the presence of complex topography, the radar backscatter varies according to the slope. Areas on the side
facing the SAR sensor will appear brighter than slopes facing away from the SAR. The mosaic combines ascending and descending passes, which illuminate the scenes from
approximately opposite viewing directions, so that slope effects are somewhat averaged out.
(VH, VV, VH/VV) backscatter RGB composite has been resampled to a spatial resolution of 20m and converted to Byte. This composite highlights the variation of
backscatter due to different polarizations.
Densely vegetated areas will have intermediate VV and VH values and a small VH/VV ratio, and appear as yellowish/green.
Water and flat bare soil will have low VH and VV but a large VH/VV ratio (appear bluish).
Urban areas tend to have high VV and VH and varying VH/VV ratio, and appear brightest in the mosaic.
The main objective of this mosaic is to examine changes in backscatter between different years (to this purpose another mosaic will be produced at the end of 2018),
and to examine the baseline backscatter over the tropical belt for future land cover change studies.
Prototyping and processing has been done in Google Earth Engine.
Acknowledgments:
Sentinel1 composite has been done by Guido Ceccherini following suggestions from Guido Lemoine.