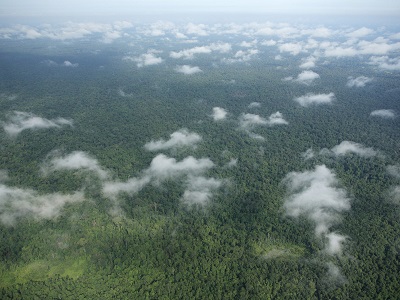
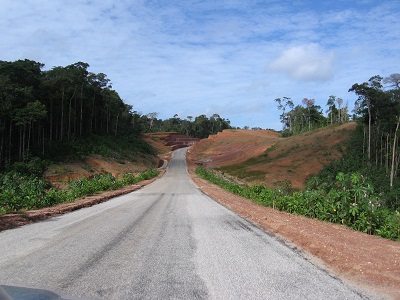
Tropical forests protect us from climate change and are a haven for biodiversity. Most forest loss, degradation and fragmentation occurs in a “risk zone” around transport networks. Although communities need roads to access markets, hospitals and schools, roads also open up the forest to possible damage. In tropical areas, new road building is often followed by secondary roads being created, often unplanned or illegal, which then trigger further degradation and deforestation. The remoteness of some areas makes it especially hard to monitor and manage this change. The RoadlessForest pilot project aims to provide up-to-date data, to help plan infrastructure wisely and spot possible areas where the forest is in danger. The Joint Research Centre of the European Commission, with funding from the European Parliament, is building a road and forest atlas for tropical regions to support sustainable development. Sustainable development and sustainable forest management is a way of protecting biodiversity, fighting desertification and responding to climate change, whilst ensuring that forest ecosystems deliver goods and services.
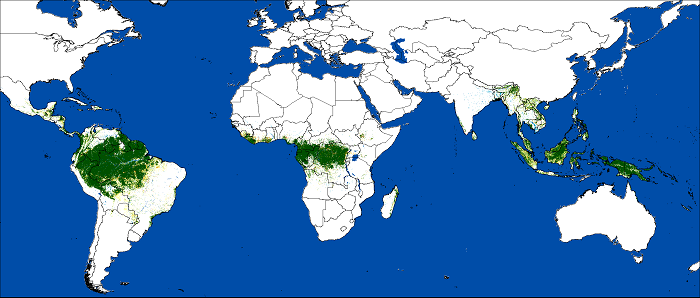
A methodology has been developed and implemented for processing 36 years of Landsat data (1 140 000 scenes) from 1982 to 2017 and mapping the tropical evergreen forest cover dynamics (deforestation, degradation, regrowth) at 30m spatial resolution. With RoadlessForest, we are also piloting crowdsourced mapping to monitor roadbuilding in remote forest areas. By modelling the deforestation process with advanced statistical approaches (such as hierarchical Bayesian models), we also aim at understanding better the role of road development in driving forest cover changes.
This unprecedented work gives globally consistent and locally relevant information on the forest state.
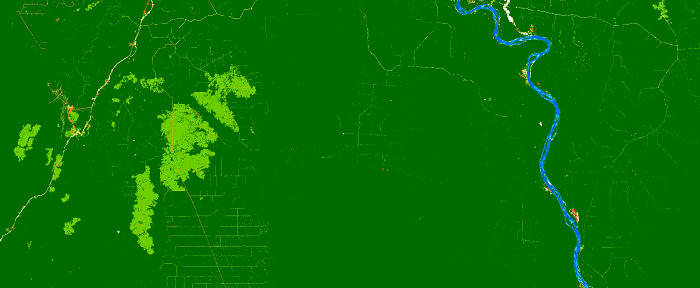
For the first time at this scale, we discriminate deforestation from degradation (where disturbances are
visible over a short period) and analyze the temporal sequences of disturbances over the 36 years. Our dataset
depicts the evergreen forest extent and patterns of disturbances through two complementary layers: (i) a
transition map, and (ii) an annual change dataset. The transition map captures the resulting disturbance
dynamics over the 36-year period, whereas the annual change dataset is a collection of 36 maps depicting -
for each year between 1982 and 2017 - the spatial extents of undisturbed forests and disturbances.
The final version of the map will be available in the near future.
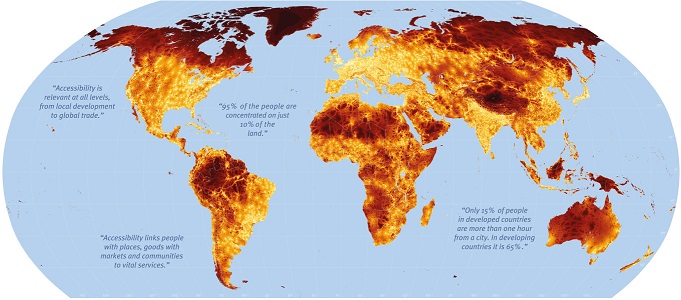
The Global Map of Accessibility characterizes the connectedness of the human landscape by illustrating the amount of time it takes to access the nearest densely populated area. Mapping accessibility to cities is a useful proxy for the relative ease by which people in rural areas can access services and resources concentrated in more urban areas. Conversely, this map measures the relative inaccessibility and remoteness of the forest areas. The map is available here.
We develop a methodology to derive a map of the probability of deforestation as a function of several spatial factors including roads. We thus isolate the effect of roadbuilding in driving deforestation from the effect of other spatial factors such as population density or topography. With the deforestation probability map, we can also identify both forest areas with high risk of deforestation and potential intact forest areas in the future. A first deforestation probability map has been produced for the whole Africa.