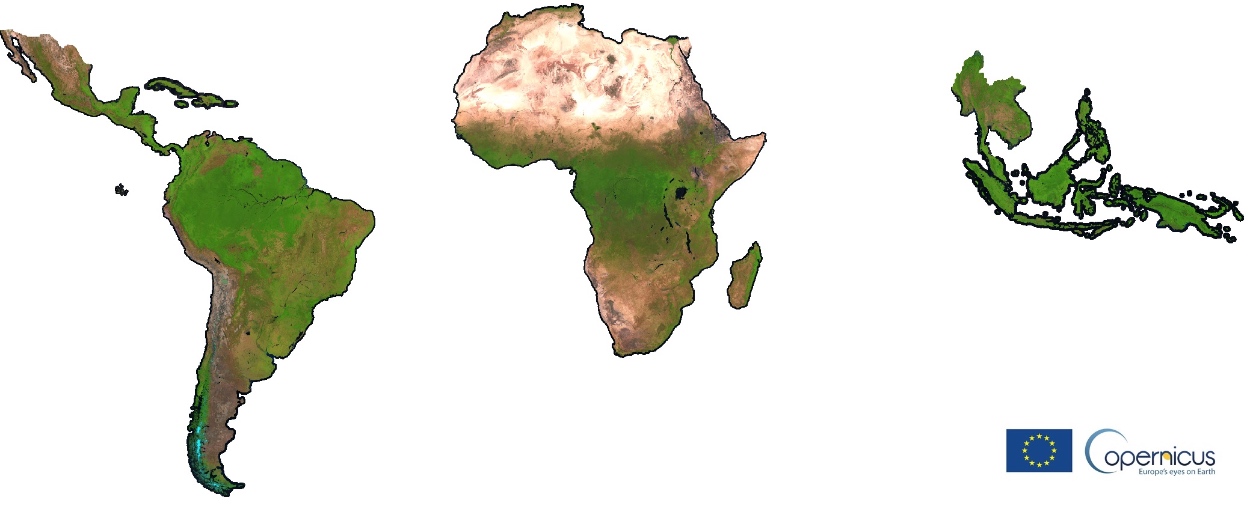
Click the map to browse the Sentinel2 composite
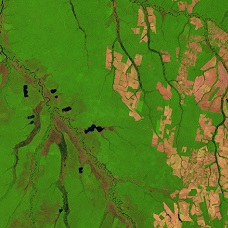
Mato Grosso State (Brazil)
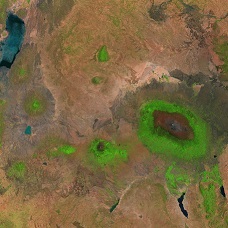
Kilimanjaro (Tanzania)
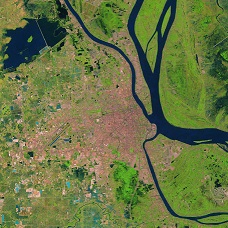
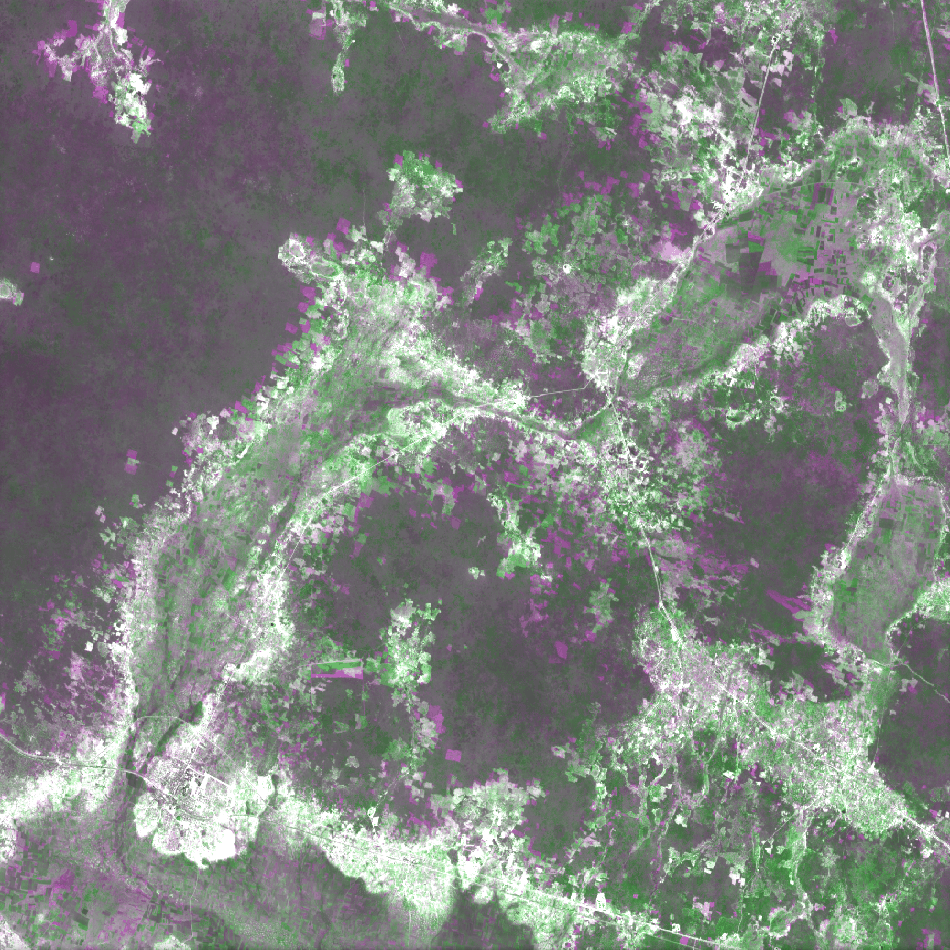
Phnom Penh City (Cambodia)
Sentinel-2 L1C cloud-free pan-tropical annual composites for the period 2015-2017, 2018, 2019 and 2020 are
compute by extracting per-band annual median values after cloud and shadow masking based on spectral conditions
specifically developed for tropical regions as described in Simonetti D. et al., 2021 and available as standalone
python code in IMPACT Toolbox.
All available Sentinel-2 images have been processed in Google Earth Engine (GEE) and downloaded by selecting
only TOA-Reflectance B11, B08, B04 (SWIR1, NIR, RED) bands at a spatial resolution of 20m (10m bands are resampled
to 20m using nearest neighbour approach) and converted to 8bit (Byte) using a multiplicative factor of 0.051 for
visualization purposes and size optimization.
Prototyping and processing has been done in Google Earth Engine.
2020 improvements
- An innovative Sentinel2 L1C cloud/shadow mask has been developed and implemented at local/regional
scale, leading to a substantial improvement in sharpness and global quality.
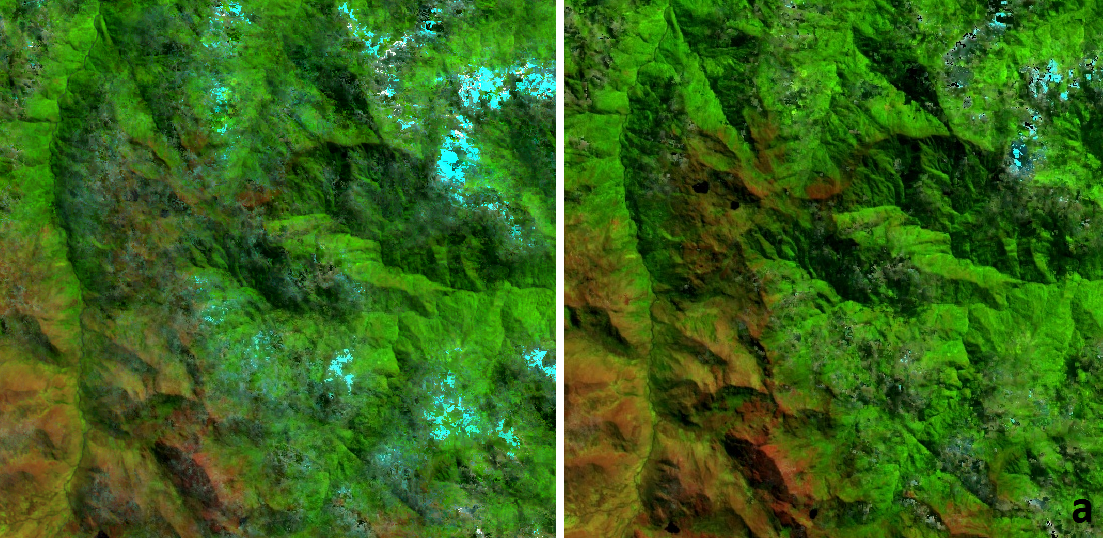
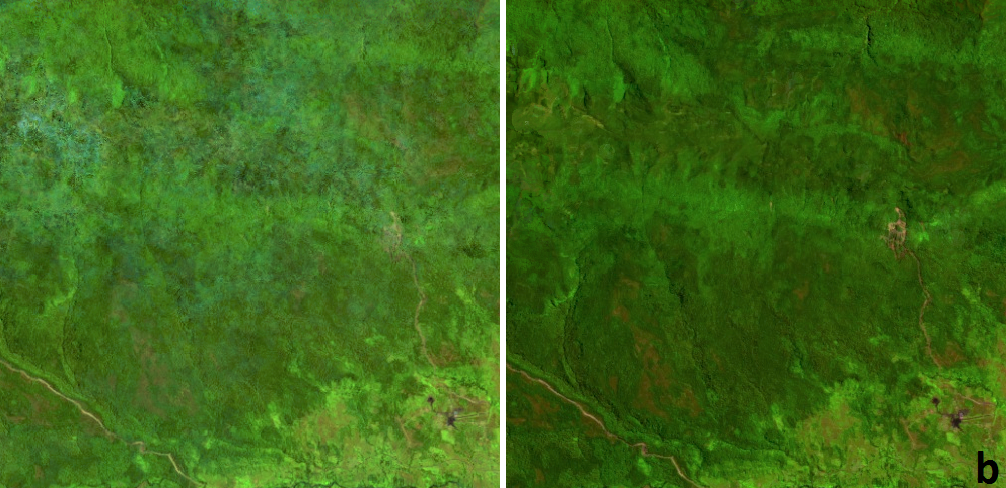
Highlands of Peru' (a) and Papua (b) are some of the cloudiest place of 2018 in the tropics:
comparison
of online composite (left) and with the new cloud/shadow mask (right, soon available)
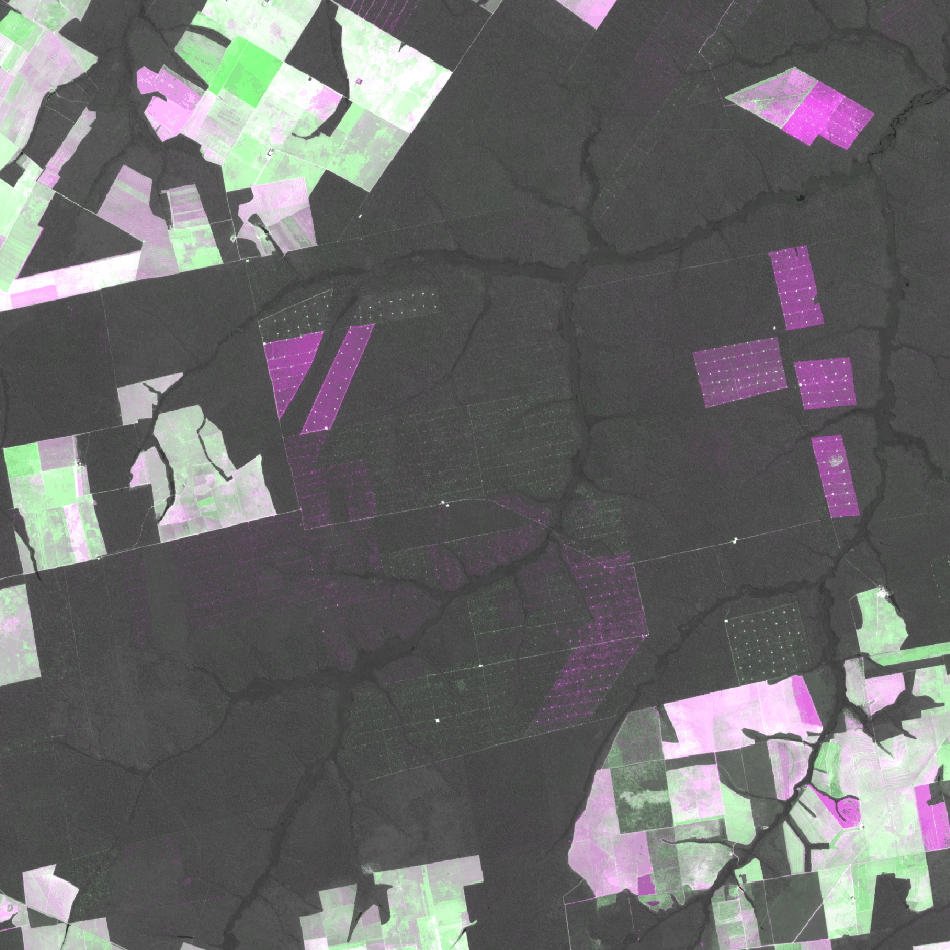
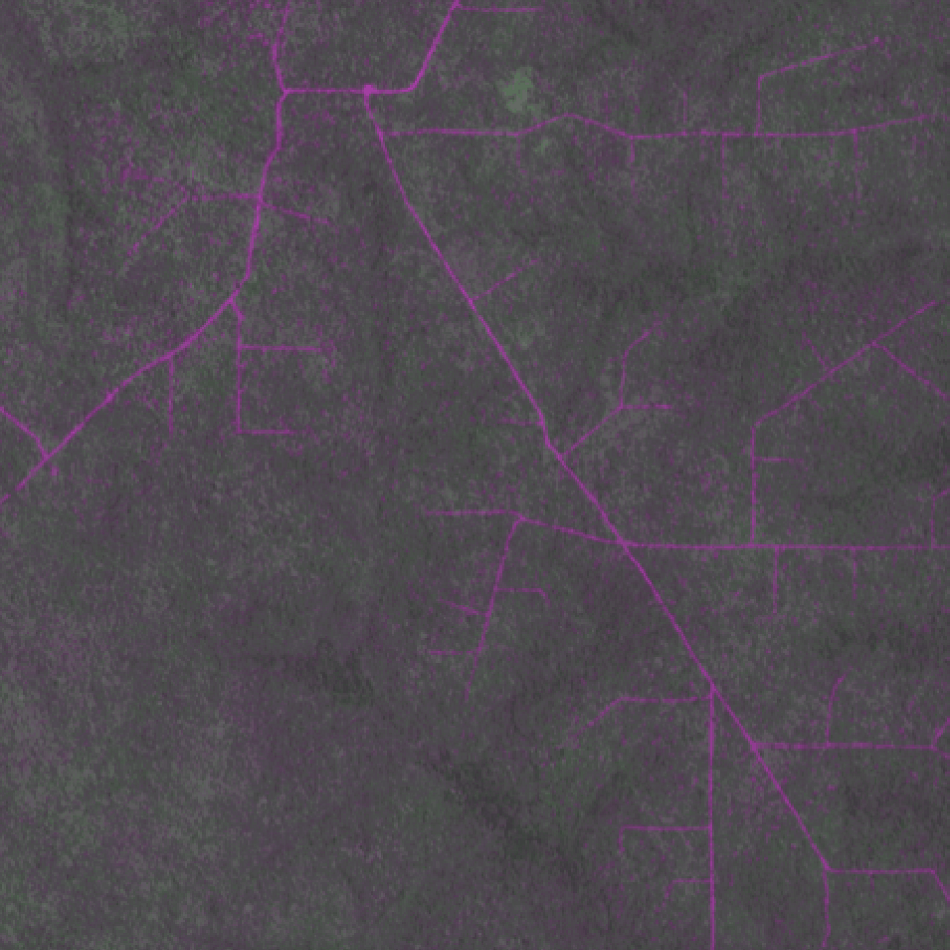
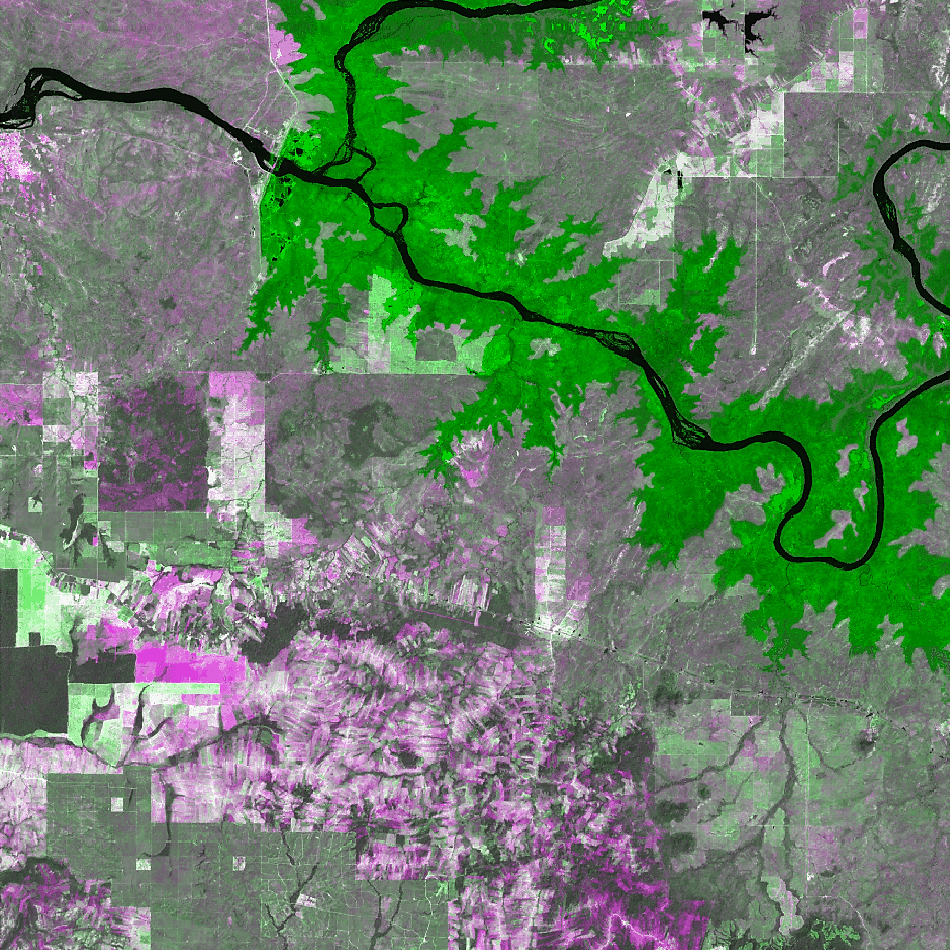
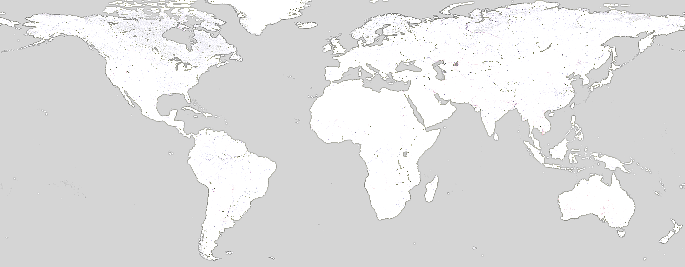
- Indication for potential change between 2015-17/2018/2019/2020 composites computed 'on the fly' based on
simple spectral distance of SWIR1 bands. The product may serve as quick "alert" for potential forest and land
cover change, to be then confirmed by visual verification. Violet and green colors correspond to an increase
(e.g. soil component) and a decrease (absorption e.g. due to vegetation growth or water) in the SWIR1 band,
respectively. Due to different processing buffers, artifacts may occour along edges.
Source code (GEE)
Customize and export your composite by using the GEE code
Download composites
Technical References
[3] Simonetti D., Marelli A., Rodriguez D., Veselin V., Strobl P., Burger A., Soille P., Achard F., Eva H., Stibig H.J., Beuchle R.
, 2017
Sentinel-2 web platform for REDD+ monitoring,online web platform for browsing and processing Sentinel-2 data for forest cover monitoring over the Tropics.
Luxembourg: Publications Office of the European Union, EUR28658; doi:10.2760/790249
https://ec.europa.eu/jrc/en/publication/sentinel-2-web-platform-redd-monitoring-online-web-platform-browsing-and-processing-sentinel-2-data