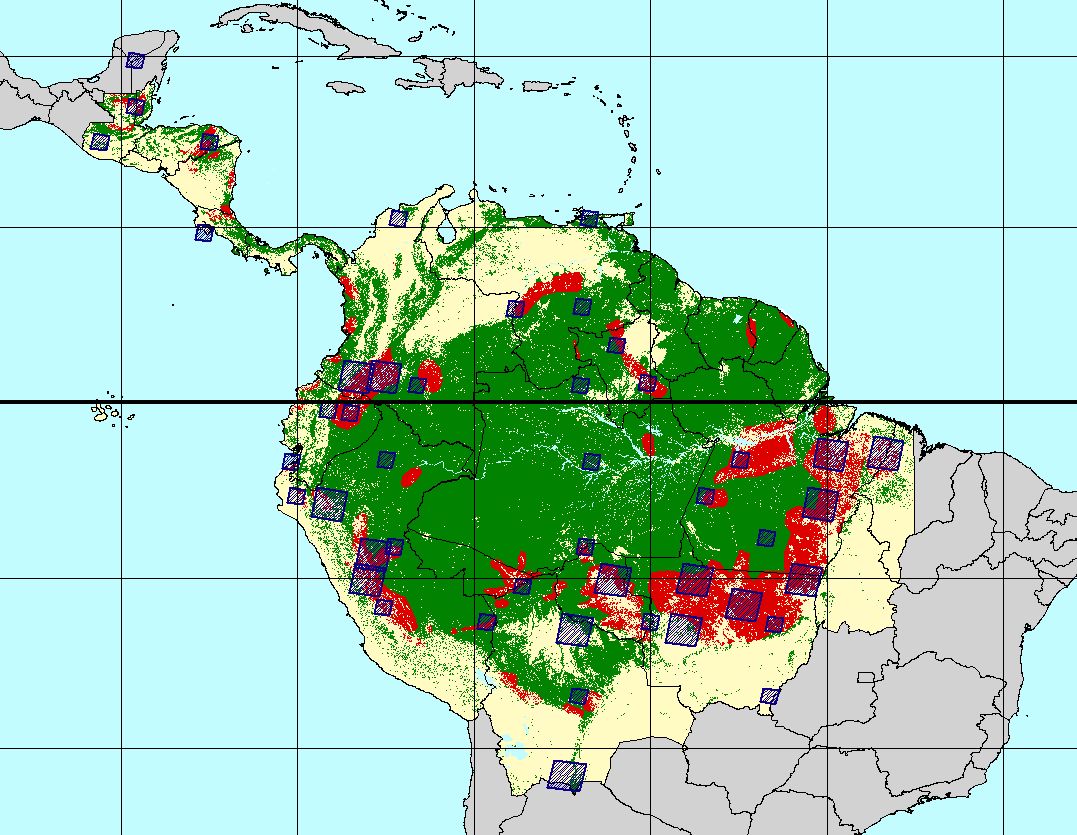
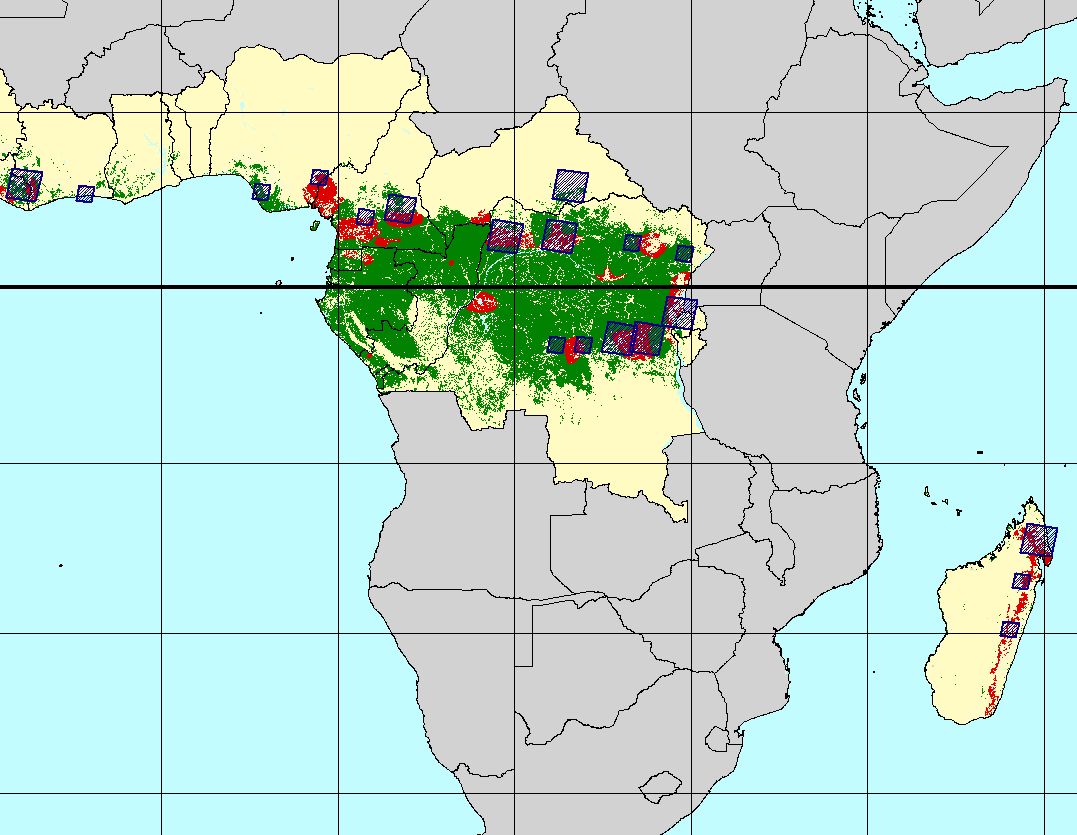
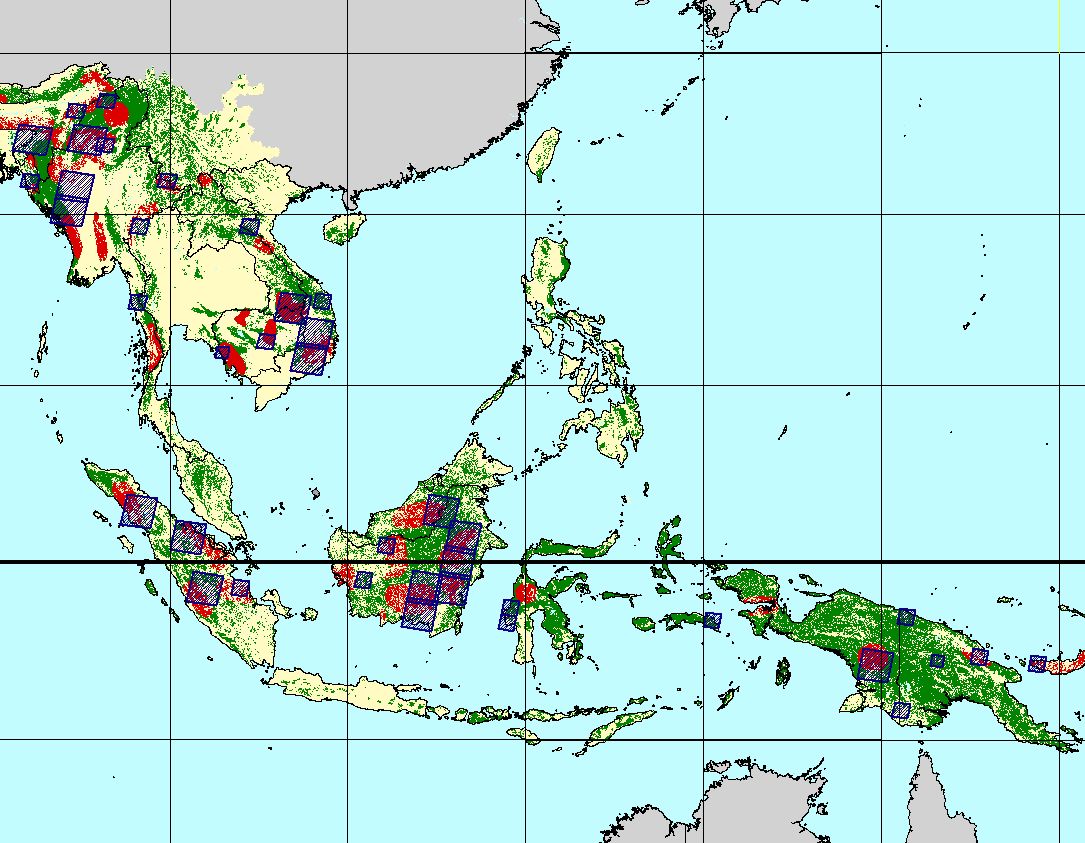
The evergreen and seasonal forests of the tropical humid bioclimatic zone covered by our work correspond closely to those forests defined by the Food and Agricultural Organization (FAO) as ‘‘Closed Broadleaved Forest’’. We did not document the woodlands and forests of the dry tropics except for continental Southeast Asia where seasonal forests are intermixed with humid forests. The forest cover figures reported by our remote sensing study refer to (1) the humid tropical forest biome of Latin America excluding both Mexico and the Atlantic forests of Brazil, (2) the humid tropical forest biome of Africa (Guineo-Congolian zone and Madagascar), and (3) the humid tropical forest biome of Southeast Asia and India, including the dry biome of continental Southeast Asia.
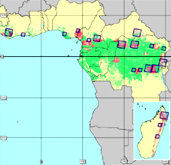
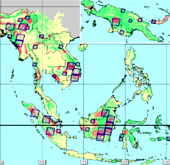
We have defined deforestation as the conversion from forests (closed, open, or fragmented forests, plantations, and forest regrowths) to non-forest lands (mosaics, natural non-forest such as shrubs or savannas, agriculture, and non-vegetated). Reforestation (or re-growth) is the conversion of non-forest lands to forests, and degradation is defined as the process within the forests whereby there is a significant reduction in either tree density or in the proportion of forest cover (from closed forests to open or fragmented forests). Estimates of global humid tropical forest area change for the period 1990–1997 were produced for four regions: (1) Pan Amazon and Central America, (2) Brazilian Amazonia and Guyanas, (3) Africa, and (4) Southeast Asia. The annual deforested area for the humid tropics is estimated at 5.8 ± 1.4 million hectares with a further 2.3 ± 0.7 million hectares of forest where degradation can be visually inferred from satellite imagery (Table 1). The three continents revealed considerable differences in percentage change rates

For more information on this topic, or for ordering a paper version of the map, please contact Frédéric Achard
Determination of deforestation rates of the world's humid tropical forests Achard, F., Eva, H., Stibig, H.J., Mayaux, P., Gallego, J., Richards, T. and Malingreau, J.P. 2002. Science 297:999-1002.
Improved estimates of net carbon emissions from land cover change in the tropics for the 1990's, Achard, F., Eva, H.D., Mayaux, P., Stibig, H.-J. and Belward, A. 2004. Global Biogeochemical Cycles. 18, GB2008, doi:10.1029/2003GB002142
Response to Comment on "Determination of Deforestation Rates of the World's Humid Tropical Forests" Eva H. D., F. Achard, H.-J. Stibig, P. Mayaux, 2003, Science 299:1015.
Tropical forest cover change in the 1990’s and options for future monitoring, Mayaux P., P. Holmgren, F. Achard, H. Eva, H.-J. Stibig and A. Branthomme 2005, Philosophical Transactions of The Royal Society B: Biological Sciences (Phil. Trans. B), 360: 373 - 384.
