List of updates integrated in the TMF 2025 products
- Integration of all 2025 Landsat 8 and 9 imagery over the pan-tropical belt
- Few corrections applied due to the geolocation (edge problems) in Brazil –Mato Grosso Province
List of updates integrated in the TMF 2024 products
-
Integration of all 2024 Landsat 8 and 9 imagery over the pan-tropical belt
-
Delineation of newly established agricultural tree plantations, primarily rubber and oil palm, based on
visual interpretation of 2024-2025 very high-resolution imagery and the spatial distribution of recent
deforestation detected by TMF.
-
Minor corrections applied to the integration of visually delineated agricultural tree plantations into
TMF Transition Map -sub type.
List of updates that are integrated in the TMF 2023 products
-
Full recomputation of TMF products based on the full dataset of reprocessed Landsat Collection 2 imagery.
The Landsat archive from 1982 to 2022 has been improved as Collection 2 in terms of geometric and radiometric
accuracies of the imagery (see:
https://www.usgs.gov/landsat-missions/landsat-collection-2).
The full Landsat Collection 2 has been used to recreate the new ‘TMF 2023’ dataset. The use of Landsat
Collection 2 results not only in better quality input data, but also in an increase in the overall number
of valid observations (i.e. observations free of cloud/cloud shadow/haze coverage or sensor issue) of 11% ,
5% and 20 % in Latin-America, Africa and Asia respectively for the period 1990-2022 compared to Landsat
Collection 1. The average number of valid observations per pixel for Landsat Collections 1 and 2 and is
presented at continental level in the figure below:

-
Addition of year 2023 from the processing of Landsat 7, 8 and 9 imagery of year 2023 available in collection 2
-
Addition of newly delineated tree plantations (that existed before 2023 and plantations established in 2023)
mainly in Central and West Africa, Indonesia and Malaysia
-
Application of improved spatial filters to remove noise or false positive in the detection of short-duration
disturbances
-
Improvements in the detection of the first year of forest degradation and deforestation events given the
enhanced input Landsat C2 data
-
Degraded Forests are defined as pixels with a maximum occurence of 3 short-duration disturbance
events observed between 1990 and 2022. These short-term events have a maximum duration of 900 days
(when disruptions, i.e. absence of tree foliage cover within a Landsat pixel, are observed) and need
to be separated by at least two years with no disturbance observation. In previous TMF versions, the
duration of the first disturbance event was recorded in number of days whereas the following events
were only characterized by their duration in number of years. In this TMF-v2023 version, the duration
in days of the first three disturbance events are recorded. Beyond an occurrence of three short-duration
disturbances events, the pixel is classified as deforestation from the starting date of the first
observed disturbance event. Note that the distinction between forest degradation and deforestation
in last three years of the analysis (i.e. including year 2023) is always based on the ratio between
the number of valid observations and the number of observed disruptions.
-
Deforestation refers to conversion of an undisturbed or degraded forest to another land cover type
which is characterised in the TMF approach as long-duration disturbance event (>900 days). The year
of deforestation is attributed to the starting year of a disturbance event of more than 900 days
duration or to the starting year of the first disturbance event when more than three consecutive
short term disturbance events are detected. In the case of forest conversion to agricultural
plantations (e.g. oil palm, coconut or rubber plantations), the year of deforestation corresponds
to the year of the first disturbance event if longer than 900 days or to the year of the second
disturbance event if the first disturbance event’s duration was less than 900 days.
-
Together, the improvement of the classification rules (for first year detection) and the reprocessing of
the full Landsat archive to collection 2 led to updates in the historical dynamic of forest degradation
and deforestation. It is important to note that change events that were detected in previous TMF version
are not removed but can be potentially reassigned to a previous year or converted to another class of change
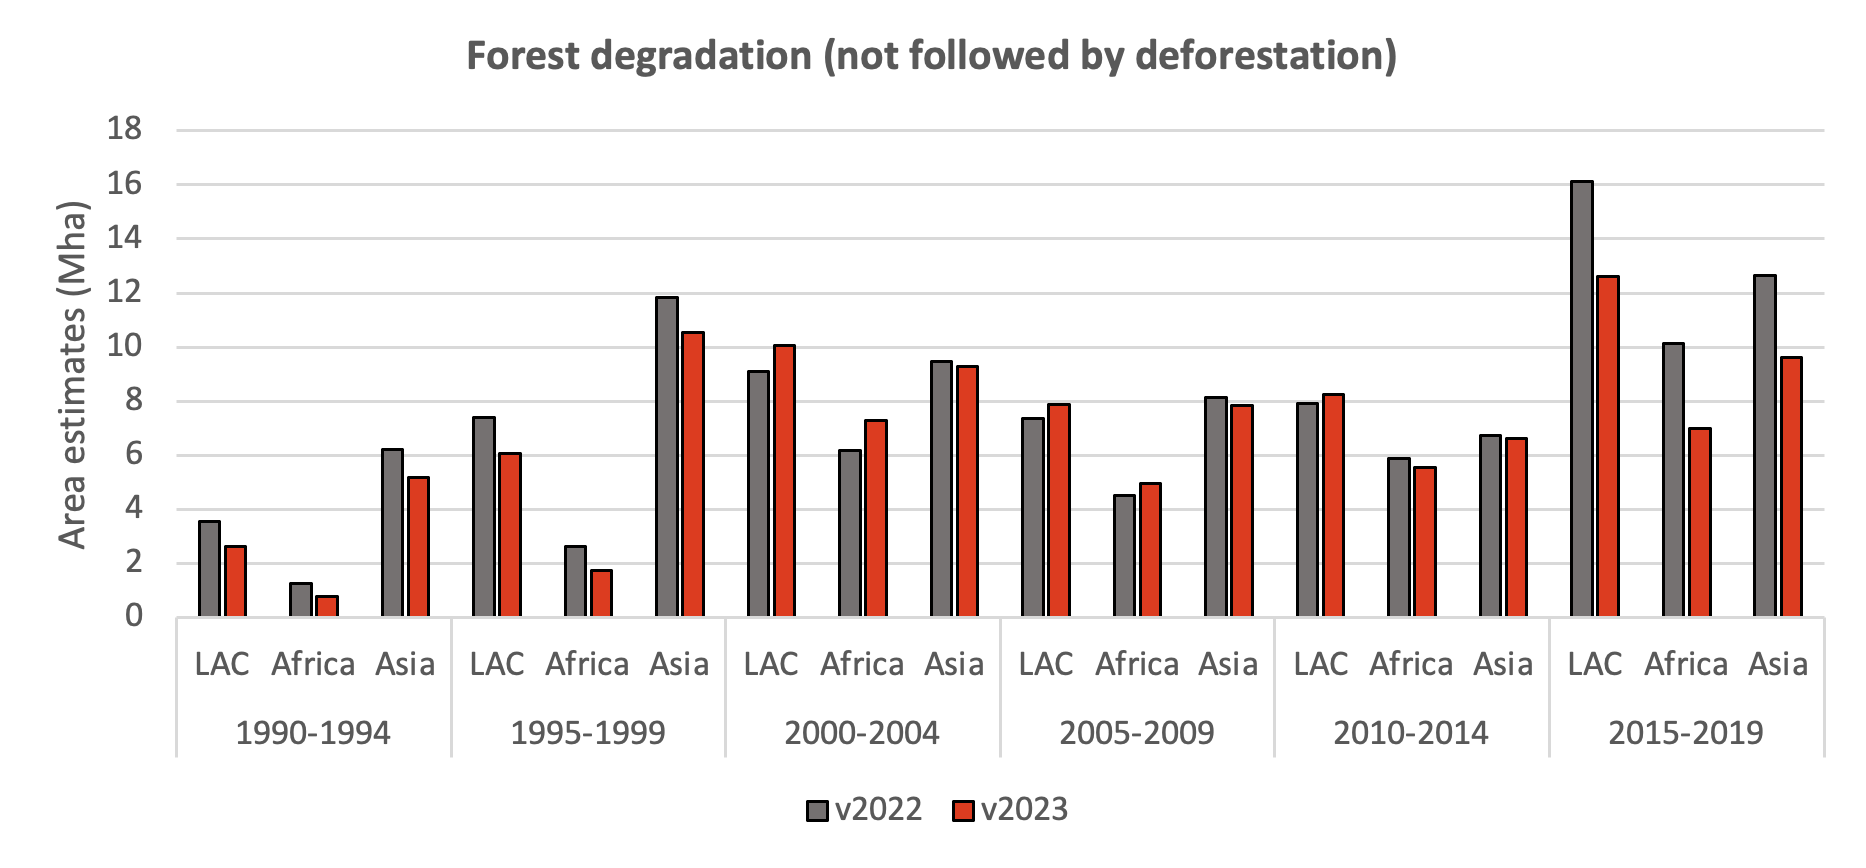
(e.g. indirect into direct deforestation). The following figures show a comparison between the area estimates
of deforestation (direct and after degradation) and forest degradation (not followed by deforestation) from
TMF version 2023 (TMFv2023) with version 2022 (TMFv2022) for five years periods from 1990 to 2019 at
continental level.
Deforestation in TMF v2023 is higher across the three continents from 1990 to 2004 compared to the previous
version v2022. . This is due to several combined factors: (1) increase in the overall number of valid
observations in particular for historical periods, (2) improvement in the distinction between degradation
and deforestation through the more accurate recording of each disturbance event’s duration, (3) earlier
attribution of the deforestation year in the case of large number of disturbance events, and (4) earlier
attribution of the deforestation year in the case of forest conversions to agricultural plantations. We
quantify an increase of 15% in total global deforestation in TMF v2023 compared to TMF v2022 for the period
1990-2022 (2%, 12% and 39% increase in LAC, Africa and Asia, respectively).
From 2010, we observe a decrease of deforestation area estimates in TMF v2023 compared to TMF v2022.
This can be explained by a decrease in deforestation after degradation after 2010 which either occurred
earlier in the time series or was reclassified into direct deforestation. Overall, deforestation of
previously degraded forest has decreased by 22% in v2023 compared to the previous version (62.3 Mha of
forest being degraded and then deforested in TMF v2023 against 79.7 Mha in TMF v2022). In other words, 27%
of forest degradation is a precursor of deforestation in TMF v2023 against 41% in TMF v2022 (and 45% in
TMF v2019).
Overall, there is a decrease of 10% in total global degradation in TMF v2023 compared to TMF v2022 for the
period 1990-2022 (8%, 12% and 11% decrease in LAC, Africa and Asia, respectively) but the trends using 5-years
reporting periods remain similar between the two versions. Around 25% of degraded forest with a single
degradation period in TMF v2022 are now classified as degradation with 2 or 3 degradation periods in TMF
v2023. Moreover, 22% of long duration degradation in TMF v2022 is now classified as deforestation followed
by forest regrowth as a result of improved classification rules and increased number of valid observations.
Finally, 25% of degradation with 2 or 3 degradation periods in TMF v2022 is now classified as forest regrowth
after deforestation and 11% as single degradation period.


New hybrid transition map at 10m (beta version)
-
A hybrid transition map is now available at a resolution of 10m for the period from 1990 to 2022. This beta
version combines the recently updated TMF map for the year 2022, derived from Landsat images at 30m, with
the detections of forest disturbances by Sentinel 2 for the year 2022 at 10m. The integration of Sentinel-2
data allows a better identification of degraded forests, and a refinement of the disturbance edges and
linear disturbances, such as logging roads and small rivers within the forest. The hybrid transition map is
available for visualisation and download via ftp or GEE, along with a map detailing the data source of each
disturbance detection. This feature allows users to identify whether disturbances were detected using
Landsat, Sentinel 2, or both sensors in query mode by clicking on the map . Historical Sentinel 2 data for
the previous years (2016-2021) will be used to produce an enhanced beta version of this hybrid transition
map when the back processing of the Sentinel 2 archive, notably the improvement of the geometric accuracy,
will be completed by ESA. Part of the small-scale forest disturbances that have been detected in the new
beta map through the use of Sentinel 2 data in 2022 may have occurred in previous years but were not
detected by 30m Landsat imagery. The use of the full Sentinel 2 archive for the final planned version of the
hybrid map is expected to enhance the overall quality of the hybrid map and mitigate the issue of timing of
the disturbance event. The final product combining the full archive of Landsat and Sentinel 2 data up to
year 2022 is intended to be delivered with an accuracy assessment.
List of updates integrated in the TMF 2022 products
-
Integration for year 2021 and year 2022 of Landsat Collection 2 imagery which is designed, amongst other
issues, to improve the geometric and radiometric accuracy of the imagery (https://www.usgs.gov/landsat-missions/landsat-collection-2).
The finalisation of the whole Landsat archive’s (1990-2020) reprocessing and integration to the TMF dataset is
foreseen for the end of 2023. This will not only result in better quality satellite image data, but increase the
overall number of available imagery for analysis. For year 2021 and at the pantropical level, we quantified an
increase of 13% in the detection of forest disturbances (new degradation or direct deforestation) from Collection-2 (C2)
compared to Collection-1 data (C1). 66% of new forest disturbances from C2 are detected by C1, while 18% are within
60m (~ 2 Landsat sized pixels) from forest disturbances detected by C1 (most probably linked to the increased geometric
accuracy in C2 data) and 16% of C2- forest disturbances are located beyond this buffer areas (most probably linked
to the increased number of Landsat scenes and valid observations). You can find below a country-level comparison
of 2021 detection of forest disturbances between C1 and C2 data:
NewForestDisturbances_2021_C1_C2_byCountry.xlsx
-
Integration for year 2022 of Landsat 9 (L9) imagery (https://www.usgs.gov/landsat-missions/landsat-9) along with
Landsat 7 and 8 (resp. L7, L8). For the pantropical region, this resulted in a 35% increase of forest disturbances
detection (new degradation or direct deforestation) in 2022. 43% of forest disturbances are detected by both L7/L8
and L9, while 31% are only detected by L7/L8 and 26% are only detected by L9. You can find below a country-level
comparison of 2022 detection of forest disturbances between L7/L8 and L9 data:
NewForestDisturbances_2022_L7_L8_L9_byCountry.xlsx
-
Integration of the global closed-canopy coconut map from Descals et al. 2023 (https://essd.copernicus.org/preprints/essd-2022-463/)
which helps refine the dynamics of forest conversion to plantations.
-
Integration of the global mangrove watch 2020 map (https://data.unep-wcmc.org/datasets/45) to refine the maximum
extent mask of mangroves which was originally defined from the 1996-2016 global mangrove watch data.
-
Delineation of new tree plantation mainly in Central, West Africa, Indonesia and Malaysia.
-
Improvements and corrections of errors in the Annual Change collection in the sequence of values for deforestation
of old regrowth forest (areas of deforestation after regrowth can now be identified using a dedicated GEE asset).
-
Afforestation can now be monitored in the Annual Change collection as the change of values 6 (other land cover) to 4 (regrowth).
List of updates integrated in the TMF 2021 products
-
We improved the identification of forest conversion to commodities (classes 81-86 in the Transition map-
Sub types) as follows:
-
We visually delineated missing plantation areas (mainly industrial plantations of oil palm, rubber,
tea…)
in Indonesia, Malaysia, Cambodia, Nigeria, Ghana and Brazil on the basis of the transition map 2020
for all areas with specific geometric shapes corresponding to plantations and very high resolution
images available from Google Earth Engine (GEE) and Planet monthly composites. We also used the
latest
version of the Spatial Database of Planted Trees from the Global Forest Watch (accessed in February
2022) to complement missing large-scale industrial plantation from the TMF dataset.
-
We fully incorporated the smallholder and industrial closed-canopy oil palm plantations dataset from
Descals et al. 2021 (https://doi.org/10.5194/essd-13-1211-2021) within the commodities mask.
-
We excluded tree plantations from the commodities mask and reclassified them into other land cover
or afforestation (classes 91-93). To do so, we used the Spatial Database of Planted Trees database
and more specifically using the plantation classes of acacia, eucalyptus, pine, teak or araucaria
but also the class forest plantation identified in the Level-2 of the MapBiomass dataset 1985-2018
(https://www.mdpi.com/2072-4292/12/17/2735/htm). This reclassification was visually checked and
completed using high-resolution images available in GEE and Planet monthly composites.
-
We used a buffer of 60m to ensure that the commodities mask did not overlap with the Open Street Map
dataset (accessed in 2019) and the built-up areas (from 1975-2014 epochs) from the Global Human
Settlement Layers P2016 (https://ghsl.jrc.ec.europa.eu/ghs_bu.php) (where TMF products are
classified as non-forest).
-
We improved the distinction between deforestation without prior degradation, deforestation occurring after
degradation and multiple events of degradation. Up to TMF version 2020, we applied two conditions to
consider that deforestation occurred after degradation: “a recurrence value lower than 58% or a recurrence
value lower than 70% with at least 6 years without any disruption events between the degradation and the
deforestation disturbances”. In this new version, we now analyze the full sequence of disruptions
(1982-2021) to better characterize complex trajectories such as direct deforestation, several events
degradation (up to 4 events of degradation) or deforestation after degradation (single or multiple short
events). Degradation is still characterized by a 2.5 years maximum duration while deforestation can be
observed for a longer time. We required a minimum period of two years between two disturbance events (with
no disruption detection).
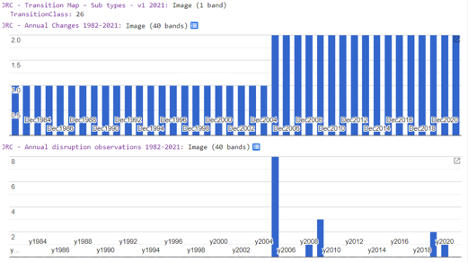
The figure below displays the values of Transition Map (2021), Annual Change (1982-2021) and disruption
observation (1982-2021) for a given pixel (long:-58.57, lat: -11.40) The sequence of disruptions shows three
distinct disturbance events of less than 2.5 years duration and separated by at least 2 years with no
disruption observation. Previously this pixel corresponded to a tropical moist forest that has been degraded
in 2005 and deforested in 2008. After corrections, this pixel is now classified as degraded forest with
three stages of short duration degradation in 2005, 2008 and 2019.
The update described above consequently improved the detection of the year of deforestation occurring after
degradation which also concerns the date of forest conversion to plantation when a prior degradation
occurred. We now provide this information as a GEE asset (see the Google Earth Engine below).
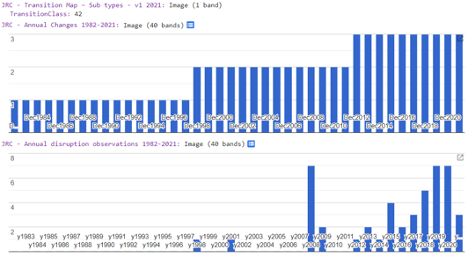
The figure below shows the information of a pixel (long:-47.76, lat: -3.49) of tropical moist forest
that has been degraded and deforested. The deforestation year in TMF version 2020 was 2001 and
corresponded to the second time a disruption was observed. After corrections, the year of deforestation
after degradation has been modified to 2012 as we detect a disturbance event of more than 3 years
duration. We also improved the detection of the several events of short duration degradation prior
deforestation (in 1998, 2001 and 2008). This improvement modifies the Transition Map but also the values
of the annual change collection.
-
We improved the separation between degradation and deforestation that started the last year (2021). Up to TMF
version 2020, a threshold of 10 disruptions was used to define a deforested land. We now calculate a ratio
between the annual number of disruption and the annual number of valid observation. We defined a threshold
of 45% (or 23% if the disturbance started after the second half of the year) on the basis of visual
identification over new logging, burning or deforestation events in 2021.
-
We now integrate deforestation of regrowth forest of at least 10 years old and reclassify this trajectory in
the Transition Map as a deforested land. To distinguish it from deforestation of undisturbed or degraded
forest, we provide a mask of deforestation of regrowth as a GEE asset (see the Google Earth Engine
below).
All of the datasets that have been produced to document the Tropical Moist Forest cover and changes over the
past three decades are being made freely available using the following delivery mechanisms: Tropical Moist Forest
Explorer, Country level statistics, Data Download, Google Earth Engine and Web Map Service. These are described
in the following sections.
Country-level statistics 1990-2025
We provide the statistics of annual forest cover changes for the period 1990-2025 at the country level for
countries with more than 1 Mha forest area in 1990. These statistics have been extracted directly from the
different TMF products. Please select the country of interest in this dropdown menu and you will retrieve
the annual area in million hectares of undisturbed TMF, degraded TMF, forest degradation, deforestation, forest
regrowth as well as many other sub-classes. More information on the different classes reported are provided
in the FAQ.
Show statistics for:
or download the CSV file with all countries' statistics.
Country factsheet on tropical forest status and dynamics of deforestation and forest
degradation
The information presented in this section is based on TMF v2023 and has not yet been updated to incorporate TMF v2024.
The fact sheets provide country-level information on land cover status, main forest types and recent (2001-2024)
dynamics of forest cover change in humid and dry tropical domains. They include automated charts and descriptions
that report the distribution of the main land cover types from the JRC TMF - Transition Map. The fact sheets also
report the trends and rates of deforestation, forest degradation from the JRC TMF Annual Change dataset. Tropical
forest cover losses outside the TMF domain are reported from the University of Maryland (UMD) Global Forest Change
products. These fact sheets are only produced for tropical countries with more than 1 Mha forest area in 1990.
Download factsheet for:
Data Download
The following spatial datasets are available for download:
Undisturbed and degraded tropical moist forest,
Transition Map - Sub types,
Transition Map - Main Classes,
Annual change collection (1990-2025),
Degradation year and
Deforestation year.
The Version of the Product appears in the file Names that are available for download e.g.
JRC_TMF_TransitionMap_Subtypes_v1_1982_2025[...].tif
Other layers (Intensity, Duration, Annual disruption observations, Annual valid observations, Start monitoring
period) are available in Google Earth Engine.
Download process
Individual 10°x10° files
The Tropical Moist Forest data are available to download in tiles 10°x10° from the map shown below. Click on the
tile to show a list of the available datasets. Each one of these datasets is a hyperlink to the *.tif file.
Supporting files
Symbology
Each of the downloadable files can be displayed in desktop GIS tools (such as QGIS or ArcGIS) using a symbology
that contains the colormap and the labels for the values. These can be added to the files by using the following
symbology files.
Metadata
The resources presented in this section are based on TMF v2024 and not yet been updated to TMF v2025.
The downloadable files do not contain any metadata information and so it is provided here for each of the
datasets. You may need to right click and Download Linked file.
Google Earth Engine
The data can also be accessed and used in the Google Earth Engine platform - for more information see
here.
The following Google Earth Engine asset ids relate to the JRC-TMF v2025 (updated through 2025 using all images
from Landsat 8 and 9 in collection 2).
| Dataset |
Asset ID 1990-2025 - TMF data in full collection 2 |
| Transition Map – Sub types | projects/JRC/TMF/v1_2025/TransitionMap_Subtypes |
| Transition Map - Main Classes | projects/JRC/TMF/v1_2025/TransitionMap_MainClasses |
| Annual change collection (1990-2025) | projects/JRC/TMF/v1_2025/AnnualChanges |
| Deforestation Year | projects/JRC/TMF/v1_2025/DeforestationYear |
| Degradation Year | projects/JRC/TMF/v1_2025/DegradationYear |
| Areas of deforestation after degradation | projects/JRC/TMF/v1_2025/DeforestationAfterDegradation |
| Deforestation after degradation Year | projects/JRC/TMF/v1_2025/DeforestationAfterDegradationYear |
| Areas of deforestation after Regrowth | projects/JRC/TMF/v1_2025/DeforestationAfterRegrowth |
| Intensity | projects/JRC/TMF/v1_2025/Intensity |
| Duration | projects/JRC/TMF/v1_2025/Duration |
| Annual Valid Observations in 2025 | projects/JRC/TMF/v1_2025/AnnualValidObs2025 |
| Annual Disruption Observations in 2025 | projects/JRC/TMF/v1_2025/AnnualDisruptionObs2025 |
The following asset ids related to JRC TMF in collection 2 are used in Google Earth Engine:
| Dataset |
Asset ID 1990-2023 - TMF data in full collection 2 |
| Transition Map – Sub types (as visible on the TMF explorer) | projects/JRC/TMF/v1_2023/TransitionMap_Subtypes |
| Transition Map - Main Classes | projects/JRC/TMF/v1_2023/TransitionMap_MainClasses |
| Annual change collection (1990-2023) | projects/JRC/TMF/v1_2023/AnnualChanges |
| Deforestation Year | projects/JRC/TMF/v1_2023/DeforestationYear |
| Degradation Year | projects/JRC/TMF/v1_2023/DegradationYear |
| Areas of deforestation after degradation | projects/JRC/TMF/v1_2023/DeforestationAfterDegradation |
| Deforestation after degradation Year | projects/JRC/TMF/v1_2023/DeforestationAfterDegradationYear |
| Areas of deforestation after Regrowth | projects/JRC/TMF/v1_2023/DeforestationAfterRegrowth |
| Intensity | projects/JRC/TMF/v1_2023/Intensity |
| Duration | projects/JRC/TMF/v1_2023/Duration |
| Annual Valid Observations 1982-2021 | projects/JRC/TMF/v1_2023/ValidObs_C2_1982_2022 |
| Annual Valid Observations in 2023 | projects/JRC/TMF/v1_2023/AnnualValidObs2023 |
| Annual Disruption Observations 1982-2022 | projects/JRC/TMF/v1_2023/Ndisturb_C2_1982_2022 |
| Annual Disruption Observations in 2023 | projects/JRC/TMF/v1_2023/AnnualDisruptionObs2023 |
The following asset ids related to JRC TMF in collection 1 are used in Google Earth Engine:
| Dataset |
Asset ID 1990-2022 |
| Transition Map – Sub types (as visible on the TMF explorer) | projects/JRC/TMF/v1_2022/TransitionMap_Subtypes |
| Transition Map - Main Classes | projects/JRC/TMF/v1_2022/TransitionMap_MainClasses |
| Annual change collection (1990-2022) | projects/JRC/TMF/v1_2022/AnnualChanges |
| Deforestation Year | projects/JRC/TMF/v1_2022/DeforestationYear |
| Degradation Year | projects/JRC/TMF/v1_2022/DegradationYear |
| Areas of deforestation after degradation | projects/JRC/TMF/v1_2022/DeforestationAfterDegradation |
| Deforestation after degradation Year | projects/JRC/TMF/v1_2022/DeforestationAfterDegradationYear |
| Areas of deforestation after Regrowth | projects/JRC/TMF/v1_2022/DeforestationAfterRegrowth |
| Intensity | projects/JRC/TMF/v1_2022/Intensity |
| Duration | projects/JRC/TMF/v1_2022/Duration |
| Annual Valid Observations 1982-2020 | projects/JRC/TMF/v1_2020/AnnualValidObs |
| Annual Disruption Observations 1982-2020 | projects/JRC/TMF/v1_2020/AnnualDisruptionObs |
| Annual Valid Observations in 2021 | projects/JRC/TMF/v1_2021/AnnualValidObs2021 |
| Annual Disruption Observations in 2021 | projects/JRC/TMF/v1_2021/AnnualDisruptionObs2021 |
| Annual Valid Observations in 2022 | projects/JRC/TMF/v1_2022/AnnualValidObs2022 |
| Annual Disruption Observations in 2022 | projects/JRC/TMF/v1_2022/AnnualDisruptionObs2022 |
| First year of the monitoring period | projects/JRC/TMF/v1_2021/StartMonitoringPeriod |
| Transition Map Hybrid - Subtypes | projects/JRC/TMF/v1_2022/TransitionMapHybrid_Subtypes |
| Transition Map Hybrid - Source | projects/JRC/TMF/v1_2022/TransitionMapHybrid_Source |
Web Map Service
The Tropical Moist Forest data can also be used within other websites or GIS clients as WMS (Web Map Service).
These service provide a direct link to the images that are used in the Tropical Moist Forest Explorer and is
the best option if you simply want to map the data and produce cartographic products.
They are not suitable for analysis as the data are represented only as RGB images.
The WMS url is: https://ies-ows.jrc.ec.europa.eu/iforce/tmf_v1/wms.py?
License
All data here are produced under studies funded by the Directorate-General for Climate Action of the European
Commission through the Roadless-For pilot project
and the Lot 2 (Tropical moist Forest Monitoring) of the ForMonPol project (Forest Monitoring for Policies).
All data are provided free of charge, without restriction of use. For the full license information see the
Copernicus Regulation of the European Commission.
Publications, models and data products that make use of these datasets must include proper acknowledgement,
including citing datasets and the journal article as in the following citation.
Disclaimer
The designations employed and the presentation of material on this map do not imply the expression of any opinion
whatsoever on the part of the European Union concerning the legal status of any country, territory, city or area
or of its authorities, or concerning the delimitation of its frontiers or boundaries.