Travel time to major cities: A global map of Accessibility
Data sources
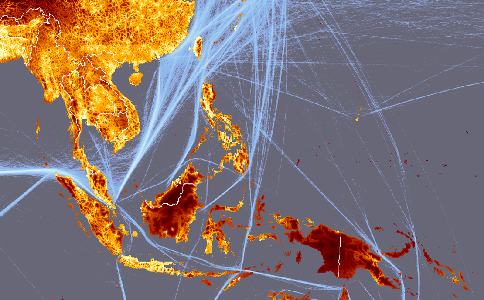 As seen in the description of the accessibility model, the cost or friction surface
is derived from several spatial datasets that represent roads, terrain, shipping lanes, land cover and any other
geographic features that should be considered when estimating the travel time to the target locations. This webpage
lists the data sources that were used in this particular accessibility model, data for the target locations
and data for the friction surface.
Target locations
-
Populated places with a population of 50,000 people or more in the year
2000 were selected from the human settlements database provided by CIESIN, Columbia University
(CIESIN, 2004). The human settlements database is one of many available from the
Global Rural and Urban Mapping Project (Balk et al., 2004) and
comprises a global dataset of about 55,000 cities and towns with populations of 1,000 or more. Each point has
geographical coordinates and associated tabular information on its population and data sources. Population data
were gathered primarily from official statistical offices (census data) and secondarily from other sources, such
as gazetteers. Where the records for populated places did not include latitude and longitude coordinates, those were
taken from the NIMA database of populated places.
Source: https://sedac.ciesin.columbia.edu/gpw/index.jsp
Further information: Balk, D., Pozzi, F., Yetman, G., Deichmann, U. and Nelson, A. 2004. The
distribution of people and the dimension of place: methodologies to improve the global estimation of urban extents.
Working Paper, CIESIN, Columbia University. Palisades, NY. pp 31.
-
Additional cities (especially for western China) were taken from a World Bank database on Air Pollution in World Cities.
Source: https://go.worldbank.org/3RDFO7T6M0
Further information: Pandey, D., Wheeler, D., Ostro, B., Deichmann, U., Hamilton, K. and
Bolt, K. 2006. Ambient Particulate Matter Concentrations in Residential and Pollution Hotspot areas of World Cities:
New Estimates based on the Global Model of Ambient Particulates (GMAPS), The World Bank Development Economics
Research Group and the Environment Department Working Paper, The World Bank, Washington DC.
Friction surface components
-
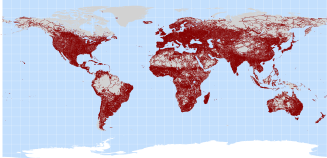 Road network data were extracted from the Vector Map Level 0 (VMap0). VMap0, released by the National
Imagery and Mapping Agency (NIMA) in 1997, is an updated and improved version of the Digital Chart of the World (DCW). The DCW is
a vector base map of the world at a scale of 1:1,000,000, developed in 1992 by the Environmental Systems Research Institute, Inc.
(ESRI) on commission for the US Defence Mapping Agency (DMA).
Travel speeds: Motorways, 120km/hr = 0.5 min per km; Major roads, 60km/hr = 1 min per km; Tracks, 10km/hr = 6 min per km;
Source:
https://www.mapability.com/info/vmap0_download.html or
https://gis-lab.info/qa/vmap0.html
Further information: https://earth-info.nga.mil/publications/vmap0.html
-
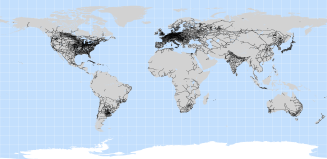 Railway network data were extracted from the Vector Map Level 0 (VMap0). VMap0, released by
the National Imagery and Mapping Agency (NIMA) in 1997, is an updated and improved version of the Digital Chart of the World
(DCW). The DCW is a vector base map of the world at a scale of 1:1,000,000, developed in 1992 by the Environmental Systems
Research Institute, Inc. (ESRI) on commission for the US Defence Mapping Agency (DMA).
Travel speeds: Railways 40 km/hr = 1.5 min per km.
Source:
https://www.mapability.com/info/vmap0_download.html or
https://gis-lab.info/qa/vmap0.html
Further information: https://earth-info.nga.mil/publications/vmap0.html
-
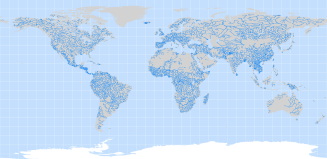 Navigable rivers were extracted from the CIA World DataBank II, which is a
collection of world map data, consisting of vector descriptions of land outlines, rivers, and political boundaries. It was
created by the U.S. government in the 1980s and has a nominal scale of 1:5,000,000.
Travel speeds: Navigable rivers, 20km/hr = 3 min per km.
Source: https://www.evl.uic.edu/pape/data/WDB/
Further information: Gorny, A. J., and R. Carter. 1987. World Data Bank II General User's Guide, Central Intelligence Agency, Washington, DC, USA.
-
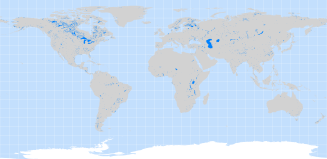 Major waterbodies above 60° North were extracted from Layer 1 of the global lakes and
wetlands database (GLWD). Other waterbodies were taken from lakes larger than one square km in the SRTM Water Body Data (SWBD).
GLWD has been developed by the World Wildlife Fund in partnership with the Center for Environmental
Systems Research, University of Kassel, Germany. SWBD is a by-product of the data editing performed by the National
Geospatial-Intelligence Agency (NGA) to produce the finished SRTM Digital Terrain Elevation Data Level 2.
Travel speeds: Major waterbodies, 20km/hr = 3 min per km.
Source: https://www.worldwildlife.org/science/data/globallakes.cfm and
ftp://e0srp01u.ecs.nasa.gov/srtm/version2/SWBD
Further information: Lehner, B. and P. Döll (2004): Development and validation of a global database of lakes, reservoirs and wetlands. Journal of Hydrology 296/1-4: 1-22.
SWBD Documentation ftp://e0srp01u.ecs.nasa.gov/srtm/version2/SWBD/SWBD_Documentation
-
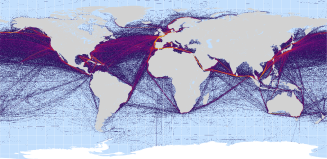 Shipping lanes were extracted from the commercial shipping layer defined in the links below.
Travel speeds: Shipping lanes, 40km/hr = 1.5 min per km; Open seas, 20km/hr = 3 min per km.
Source: https://www.nceas.ucsb.edu/GlobalMarine/impacts
Further information: Science 15 February 2008: Vol. 319. no. 5865, pp. 948 - 952
-
 National borders were extracted from the Vector Map Level 0 (VMap0). VMap0,
released by the National Imagery and Mapping Agency (NIMA) in 1997, is an updated and improved version of the Digital Chart of
the World (DCW). The DCW is a vector base map of the world at a scale of 1:1,000,000, developed in 1992 by the Environmental
Systems Research Institute, Inc. (ESRI) on commission for the US Defence Mapping Agency (DMA).
Travel speeds: Variable from 60km/hr = 1 min per km to 0.25km/hr = 240 min per km.
Source: Authors calculations based on a border dataset provided by Uwe Deichmann (World Bank, Development Research Group), sourced from
https://www.mapability.com/info/vmap0_download.html or
https://gis-lab.info/qa/vmap0.html
Further information: https://earth-info.nga.mil/publications/vmap0.html
-
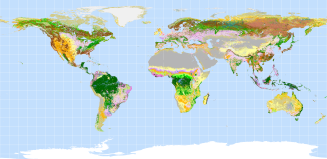 Land cover classes were extracted from the GLC2000 dataset. GLC2000 was produced by
JRC in collaboration with over 30 research teams from around the world. The project was carried out to provide accurate baseline
landcover information to the International Conventions on Climate Change, the Convention to Combat Desertification, the Ramsar
Convention and the Kyoto Protocol.
Travel speeds:
- Tree Cover, broadleaved, evergreen: 60 mins per km
- Tree Cover, broadleaved, deciduous, closed: 60 mins per km
- Tree Cover, broadleaved, deciduous, open: 48 mins per km
- Tree Cover, needle-leaved, evergreen: 36 mins per km
- Tree Cover, needle-leaved, deciduous: 36 mins per km
- Tree Cover, mixed leaf type: 36 mins per km
- Tree Cover, regularly flooded, fresh water: 60 mins per km
- Tree Cover, regularly flooded, saline water: 60 mins per km
- Mosaic: Tree Cover / Other natural vegetation: 48 mins per km
- Tree Cover, burnt: 48 mins per km
- Shrub Cover, closed-open, evergreen: 36 mins per km
- Shrub Cover, closed-open, deciduous: 36 mins per km
- Herbaceous Cover, closed-open: 36 mins per km
- Sparse herbaceous or sparse shrub cover: 24 mins per km
- Regularly flooded shrub and/or herbaceous: 60 mins per km
- Cultivated and managed areas: 36 mins per km
- Mosaic: Cropland / Tree Cover / Other natural veg.: 36 mins per km
- Mosaic: Cropland / Shrub and/or grass cover: 36 mins per km
- Bare Areas: 24 mins per km
- Water Bodies: Not used - replaced by shipping lane, river and waterbody layers
- Snow and Ice: 48 mins per km
- Artificial surfaces and associated areas (22) : 2 mins per km
Source: https://gem.jrc.ec.europa.eu/glc2000/defaultGLC2000.htm
Further information: Bartholomé, E. and Belward, A.S., 2005., GLC2000: A New Approach to Global Land Cover Mapping From Earth Observation Data. International Journal of Remote Sensing, 26(9).
-
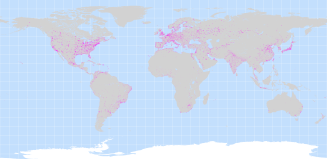 Urban areas were extracted from the 30 arc-second land area grid showing urban areal extents worldwide
which is part of the Global Rural-Urban Mapping Project (GRUMP). The human settlements database is one of many available from the Global
Rural and Urban Mapping Project (Balk et al., 2004) and comprises a global dataset of about 55,000 cities and towns with populations
of 1,000 or more.
Travel speeds: Urban areas, 30km/hr = 2 min per km.
Source: https://sedac.ciesin.columbia.edu/gpw/index.jsp
Further information: Balk, D., Pozzi, F., Yetman, G., Deichmann, U. and Nelson, A. 2004. The distribution of
people and the dimension of place: methodologies to improve the global estimation of urban extents. Working Paper, CIESIN,
Columbia University. Palisades, NY. pp 31.
-
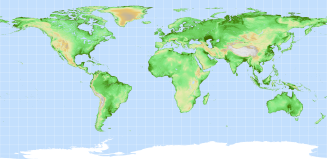 Elevation was extracted from the 30 arc-second elevation product SRTM30 (Shuttle Radar Topography Mission).
Data are based on the 30" averages of topography derived from the 3" USGS SRTM gridded DEM data product. GTOPO30 data are used for high
latitudes where SRTM data are not available.
Effect on travel speeds: For elevations lower than 2000 metres, there is no effect on foot-based based travel speed. For
elevations above 2000, the following speed factor f is applied:
f = 0.15e0.0007E, where E is elevation in metres.
The resulting elevation factor was used as a multiplier against foot-based travel components.
Source: Authors calculation based on ftp://e0srp01u.ecs.nasa.gov/srtm/version2/SRTM30
Further information: ftp://e0srp01u.ecs.nasa.gov/srtm/version2/SRTM30/srtm30_documentation.pdf
-
 Slope in integer degrees was computed from the SRTM30 digital elevation model using the SLOPE command in
Arc Info Workstation (GRID) to compute the slope in the direction of steepest slope. Elevation was extracted from
the 30 arc-second elevation product SRTM30 (Shuttle Radar Topography Mission). Data are based on the 30" averages of topography derived
from the 3" USGS SRTM gridded DEM data product. GTOPO30 data are used for high latitudes where SRTM data are not available.
Effect on travel speeds: The effect of slope on travel speeds is based on van Wagtendonk and Benedict (1980)
and is computed as follows: v = v0e-ks
Where:
v = off road foot based velocity over the sloping terrain,
v0 = the base speed of travel over flat terrain, 5km/hr in this case,
s = slope in gradient (metres per metre) and,
k = a factor which defines the effect of slope on travel speed
For this case we assume a base walking speed of 5km/hr and k = 3.0 and constant for uphill and downhill travel. The velocities over the
slope grid were computed and then converted into a friction factor by dividing the base speed by the slope speed. This was then
used as a multiplier against foot-based travel components.
Source: Authors calculation based on ftp://e0srp01u.ecs.nasa.gov/srtm/version2/SRTM30
Further information: ftp://e0srp01u.ecs.nasa.gov/srtm/version2/SRTM30/srtm30_documentation.pdf
 As seen in the description of the accessibility model, the cost or friction surface
is derived from several spatial datasets that represent roads, terrain, shipping lanes, land cover and any other
geographic features that should be considered when estimating the travel time to the target locations. This webpage
lists the data sources that were used in this particular accessibility model, data for the target locations
and data for the friction surface.
 Road network data were extracted from the Vector Map Level 0 (VMap0). VMap0, released by the National
Imagery and Mapping Agency (NIMA) in 1997, is an updated and improved version of the Digital Chart of the World (DCW). The DCW is
a vector base map of the world at a scale of 1:1,000,000, developed in 1992 by the Environmental Systems Research Institute, Inc.
(ESRI) on commission for the US Defence Mapping Agency (DMA).
 Railway network data were extracted from the Vector Map Level 0 (VMap0). VMap0, released by
the National Imagery and Mapping Agency (NIMA) in 1997, is an updated and improved version of the Digital Chart of the World
(DCW). The DCW is a vector base map of the world at a scale of 1:1,000,000, developed in 1992 by the Environmental Systems
Research Institute, Inc. (ESRI) on commission for the US Defence Mapping Agency (DMA).
Travel speeds: Railways 40 km/hr = 1.5 min per km.
 Navigable rivers were extracted from the CIA World DataBank II, which is a
collection of world map data, consisting of vector descriptions of land outlines, rivers, and political boundaries. It was
created by the U.S. government in the 1980s and has a nominal scale of 1:5,000,000.
 Major waterbodies above 60° North were extracted from Layer 1 of the global lakes and
wetlands database (GLWD). Other waterbodies were taken from lakes larger than one square km in the SRTM Water Body Data (SWBD).
GLWD has been developed by the World Wildlife Fund in partnership with the Center for Environmental
Systems Research, University of Kassel, Germany. SWBD is a by-product of the data editing performed by the National
Geospatial-Intelligence Agency (NGA) to produce the finished SRTM Digital Terrain Elevation Data Level 2.
 Shipping lanes were extracted from the commercial shipping layer defined in the links below.
 National borders were extracted from the Vector Map Level 0 (VMap0). VMap0,
released by the National Imagery and Mapping Agency (NIMA) in 1997, is an updated and improved version of the Digital Chart of
the World (DCW). The DCW is a vector base map of the world at a scale of 1:1,000,000, developed in 1992 by the Environmental
Systems Research Institute, Inc. (ESRI) on commission for the US Defence Mapping Agency (DMA).
 Land cover classes were extracted from the GLC2000 dataset. GLC2000 was produced by
JRC in collaboration with over 30 research teams from around the world. The project was carried out to provide accurate baseline
landcover information to the International Conventions on Climate Change, the Convention to Combat Desertification, the Ramsar
Convention and the Kyoto Protocol.
 Urban areas were extracted from the 30 arc-second land area grid showing urban areal extents worldwide
which is part of the Global Rural-Urban Mapping Project (GRUMP). The human settlements database is one of many available from the Global
Rural and Urban Mapping Project (Balk et al., 2004) and comprises a global dataset of about 55,000 cities and towns with populations
of 1,000 or more.
 Elevation was extracted from the 30 arc-second elevation product SRTM30 (Shuttle Radar Topography Mission).
Data are based on the 30" averages of topography derived from the 3" USGS SRTM gridded DEM data product. GTOPO30 data are used for high
latitudes where SRTM data are not available.
 Slope in integer degrees was computed from the SRTM30 digital elevation model using the SLOPE command in
Arc Info Workstation (GRID) to compute the slope in the direction of steepest slope. Elevation was extracted from
the 30 arc-second elevation product SRTM30 (Shuttle Radar Topography Mission). Data are based on the 30" averages of topography derived
from the 3" USGS SRTM gridded DEM data product. GTOPO30 data are used for high latitudes where SRTM data are not available.